Insert excerpt _ExcerptAnalyticsDashboardsOverview _ExcerptAnalyticsDashboardsOverview nopanel true
...
Within Agents you can report on:
Email
Licence
Name
Phone number
Physical location
Username
WebRTC
For a complete list of agent event fields and their descriptions, see Agents fields.
Agent events
Each row of data represents a single event for an agent. Agent events can be one of two types — presence and interaction — and each event also has a category:
...
Within Users you can report on:
Active
Agent configuration
Agent ID
Phone number
Physical location
WebRTC
Days since last login
Email
Last login date Date
Licence
Locked
Name
User ID
Username
For a complete list of users fields and their descriptions, see Users fields.
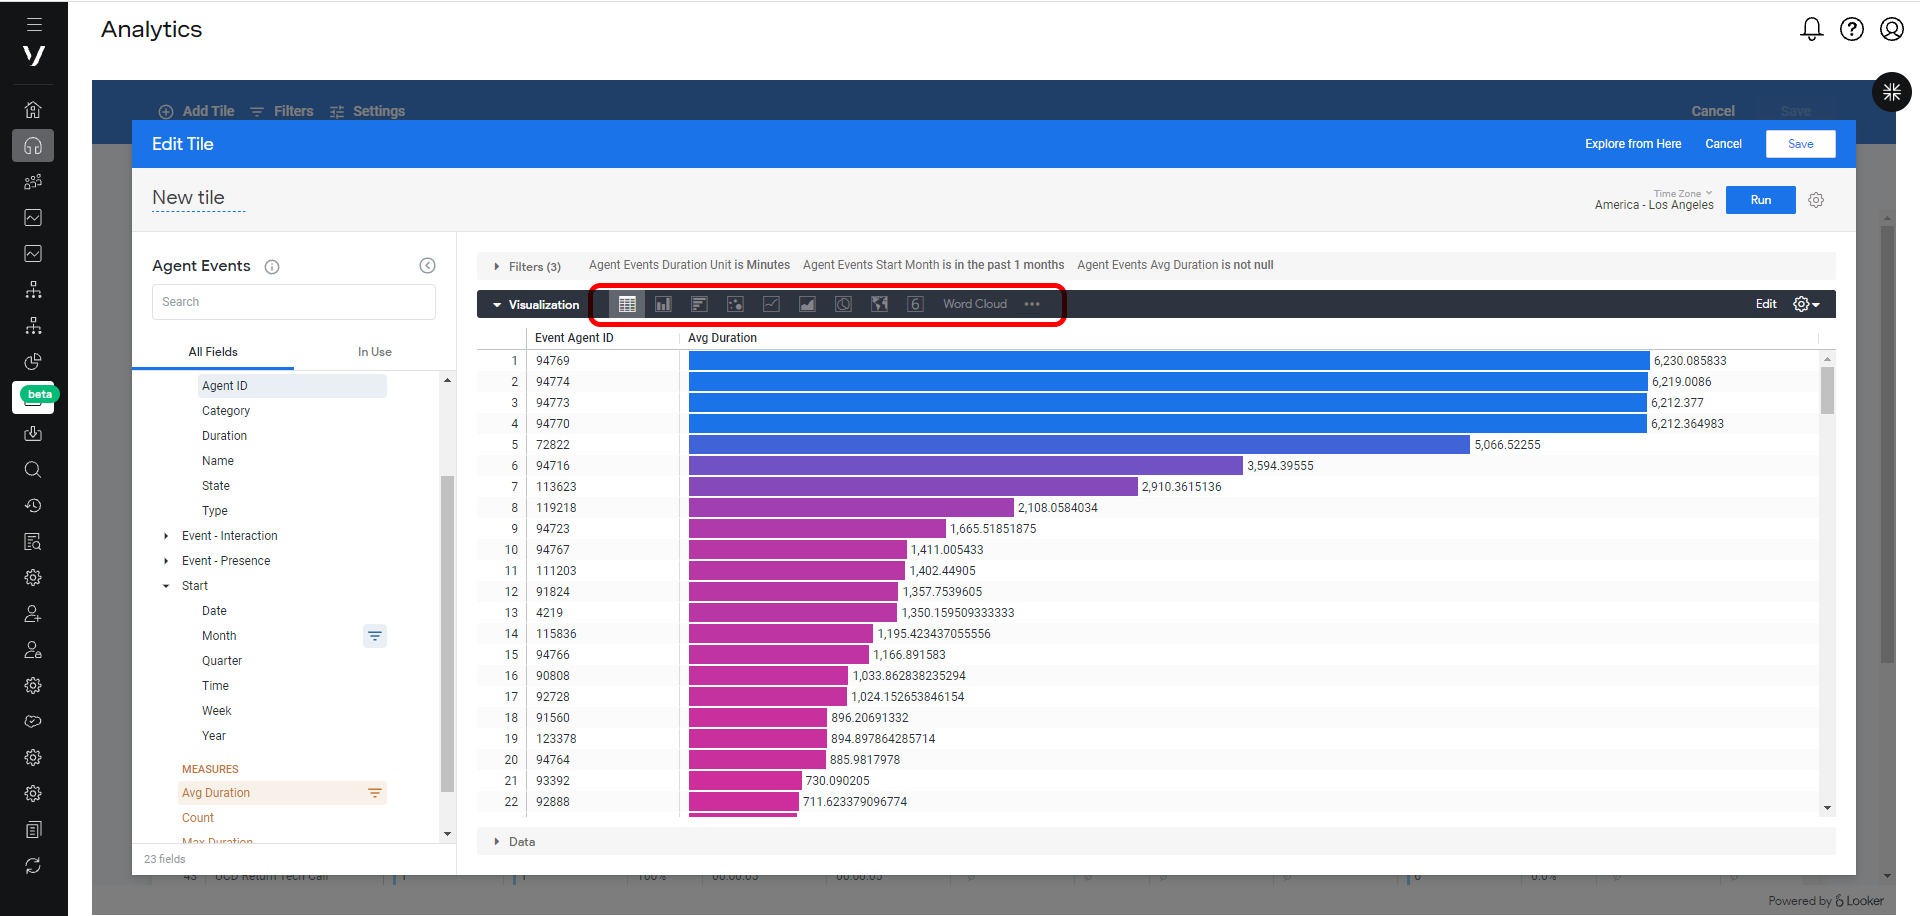
What visualization options are available for tiles?
Tiles display data in different forms, or visualizations. Visualizations can be divided to different types, where each type has different settings you can use to customize its look. Different data works better in some visualizations than others.
Visualizations can be of the following types:
- Cartesian charts
Column
Bar
Scatterplot
Line
Area
- Pie and donut charts
Pie
Donut Multiples
- Progression charts
Funnel
Timeline
Waterfall
- Text and table
Single Value
Single Record
Table
Table (Legacy)
Word Cloud
- Maps
- Map
- Static Map (Regions)
- Static Map (Points)
- Other charts
- Boxplot
...
Historical Analytics can report on data from 14th February 2018 onwards. Data from before 14th February 2018 can be retrieved only from Stats and Reports.
Who can access Historical Analytics?
...
