Monitoring a queue
Real Time (legacy) is deprecated
Real Time (legacy) is now deprecated.
- To create and manage agents and groups, use User Admin the VCC Admin Portal.
- To monitor the performance of your Vonage Contact Center account, use Real-time Analytics, Historical Analytics, and Team Monitoring.
- To monitor agents' interactions, log agents in to VCC, and change agents' states, use Team Monitoring.
For more information, see User Admin, Real-time Analytics, Historical Analytics, and Team Monitoring.
How do I monitor a queue's activity?
A queue that appears in Real Time is an instance of an Automatic Call Distributor (ACD) applet. For information on ACD applets, see Automatic Call Distributor (ACD) or Universal Contact Distributor (UCD) applet. You can monitor a queue in Real Time.
You can see the following information about a queue that you have added to the Real Time desktop. For information on adding queues to the desktop, see Organizing the Real Time desktop.
The left side displays the following information about the current status of the queue:
- The number of calls in the queue. If the queue contains one or more calls, the following information appears:
- The average time, in seconds, that the call or calls have been in the queue
- The time, in seconds, that the longest waiting call has been in the queue
- The number of logged in agents who are assigned to this queue
- The distribution of states that the assigned agents are in
- The current service level (svc). A service level is the actual percentage of interactions that were answered within the target answer time. For more information about service levels and target answer times, see Queue thresholds.
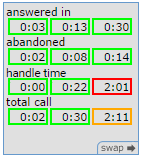
The right side displays three different views of historical data:
- The default view displays the total number of calls, and then a breakdown of the calls, as follows:
- Calls answered by an agent in the queue.
- Call abandoned by the caller before being answered.
- Calls ended by the caller pressing a breakout key.
- Calls that overflowed to another queue because:
- The call spent too much time in the queue.
- The queue was full.
- No agents were serving the queue.
The second view displays minimum, average, and maximum times for:
- answered in. How long it took an agent to answer the call.
- abandoned. How soon a caller abandoned the call.
- handle time. How long the agent spent handling the call. The handle time includes connected time and wrap time.
total call. How long it took for an agent to answer the call plus the actual handle time.
The third view displays a list of the IDs of the groups that serve the queue
Click swap to switch between the different views. The views can contain up to 24 hours of historical data. You set the time from which the data is recorded for that 24 hour period in the queue history start section of the toolbar. For information on the queue history start section, see Setting queue history start time.
Click the arrow in the upper-right corner of the queue one or more times to display different views of the information. For example:
(This view only appears if enabled for your account.)
For general assistance, please contact Customer Support.
For help using this documentation, please send an email to docs_feedback@vonage.com. We're happy to hear from you. Your contribution helps everyone at Vonage! Please include the name of the page in your email.


